Data Stories: infographics that tell a story
All Data Stories are clickable PDFs for download and/or printing.
2022 Data Stories - Annual Survey of Museum-Goers
2021 Data Stories - Annual Survey of Museum-Goers
Museums and Trust 2021
Free download of this graphic research report fielded on behalf of the American Alliance of Museums. |
Teaching Inclusive History: Educator Needs
Explore the needs of educators as they teach the most emotionally difficult content in schools. Free PDF download here. |
Audiences and Inclusion:
A Primer for Cultivating More Inclusive Attitudes Among the Public
2021 Data Stories - COVID Audience Research (scroll down for Data Stories from 2020)
2020 Data Stories - Annual Survey of Museum-Goers
The Purpose of Learning
2020 Annual Survey of Museum-Goers: Data Story #6 |
Museums and Neutrality:
Taking Positions in a Polarized Society 2020 Annual Survey of Museum-Goers Data Story #5 |
Worldviews, Clusters, and Intuitive Epistemology: An Introduction
2020 Annual Survey of Museum-Goers: Data Story #4 |
2020 Data Stories - COVID Audience Research
Broader Population Concerns for Museums. Museums and the Pandemic: Data Story #6
|
Hope and Healing. Museums and the Pandemic: Data Story #5
|
Museums Are Struggling Financially. Do People Know? Will They Support Us? Museums and the Pandemic: Data Story #4
|
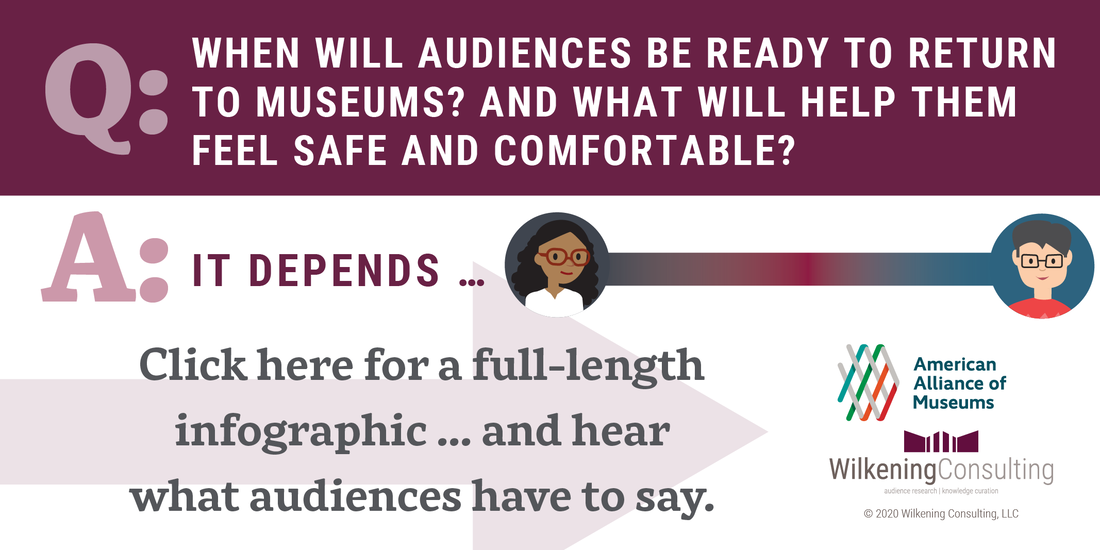
When Will Audiences Be Ready to Return to Museums? And What Will Help Them Feel Safe and Comfortable? Museums and the Pandemic: Data Story #3
|
Do Audiences Want Virtual Content from Museums? Museums and the Pandemic: Data Story #2
|
How Are Museum-Goers Responding to the COVID-19 Pandemic? Museums and the Pandemic: Data Story #1
|
2019 Data Stories
2018 Data Stories
2017 Data Stories